Build a list and see it as a heatmap
Group the stocks you follow into lists, then flip to a heatmap to read the whole group at once.
This feature is part of a paid plan.
Lists let you organize the names you follow into groups that make sense to you, a sector, a theme, a portfolio, or a shortlist you are watching into earnings.
Three ways to read a list
Switch with the Table, Charts and RS Heatmap buttons next to the list name. Whichever you pick is remembered for all your lists.
Table view
The full detail for every name, with the same columns as the screener. Add or remove them with Columns, and click a header to sort.
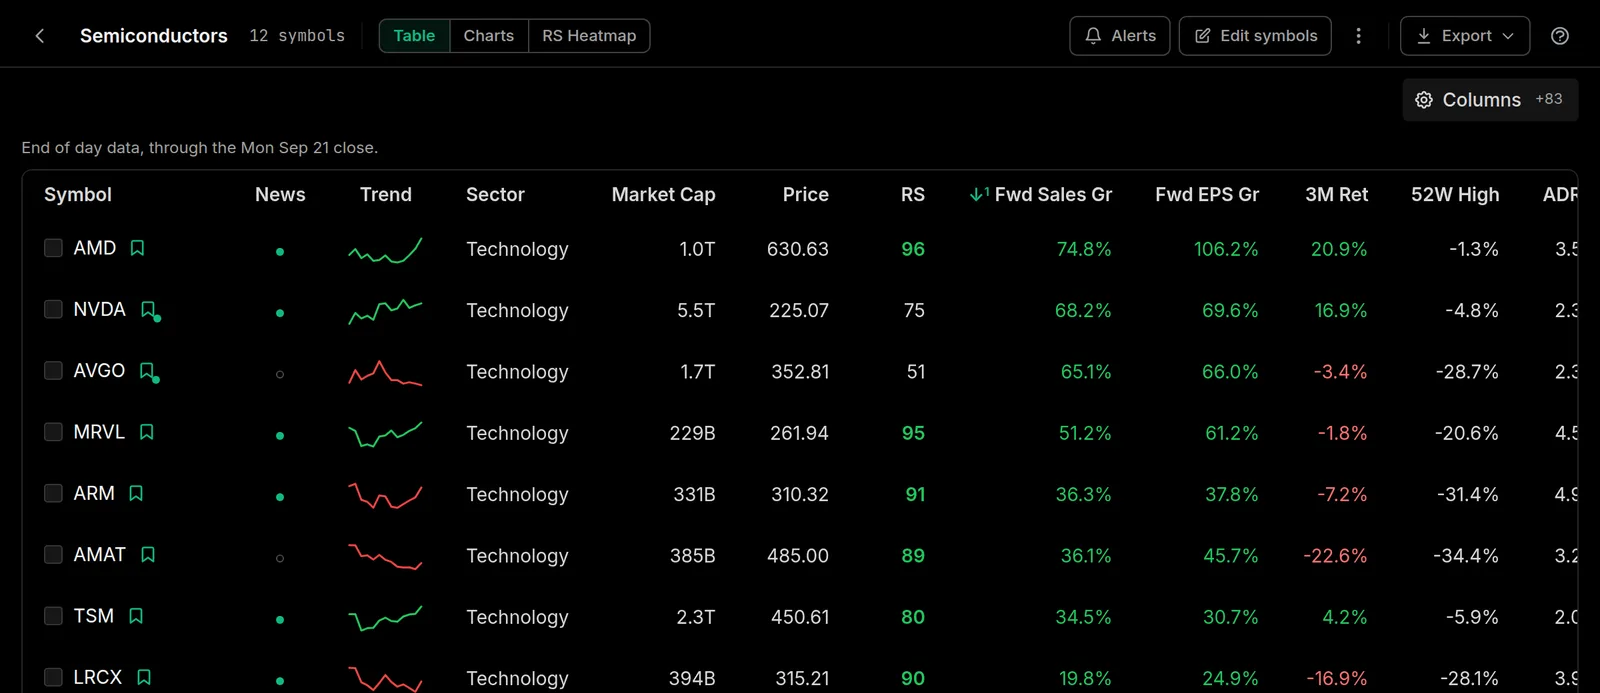
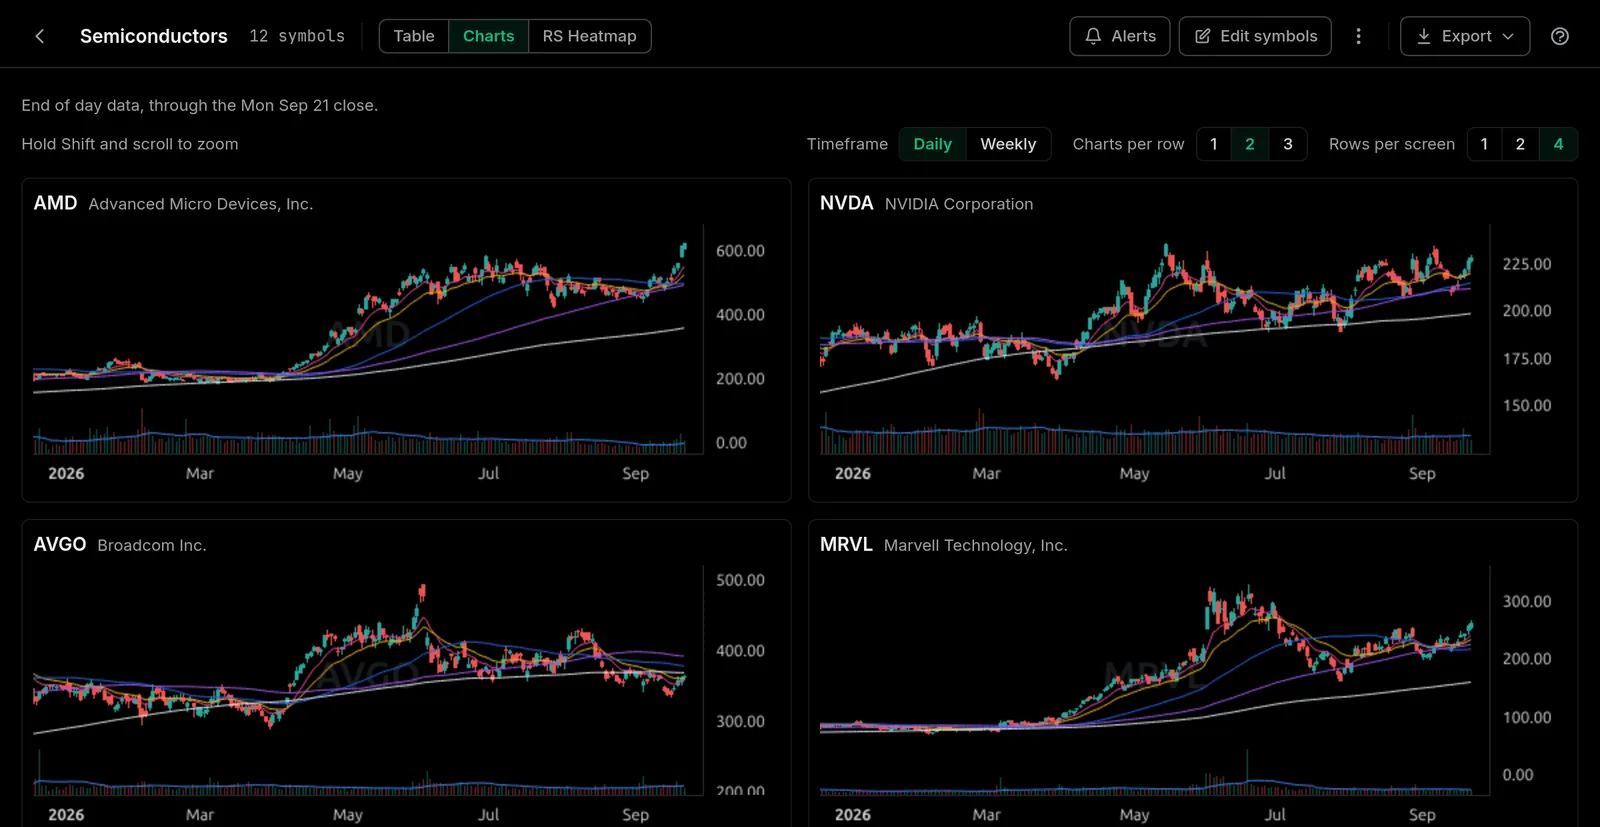
Charts view
A price chart for every name on the list, daily or weekly, to scroll through. Pick how many charts sit in a row and how many rows fit on a screen.
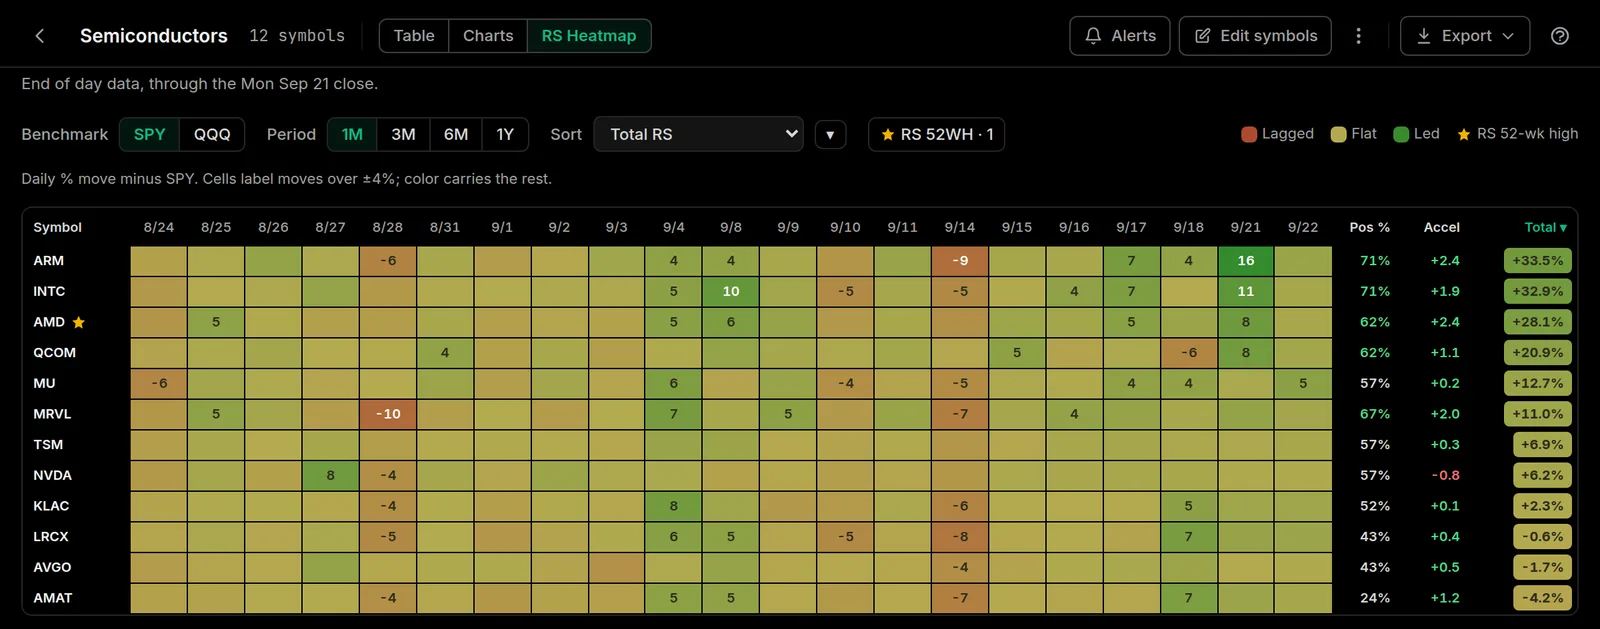
RS Heatmap view
One row per name and one column per day, each cell colored by how the stock did against SPY that day. Green led the market, red lagged it. Switch the benchmark to QQQ, change the period, and sort by total relative strength.
Handy with hover peek
Turn on hover chart peek and you can hover any name in a list to see its chart without opening it.
Lists are part of a paid plan. You can see how they work before subscribing, and everything you build stays with your account.