After earnings, and gap fill
The two statistical reads on a stock: how it has traded around its earnings, and how often it fills its overnight gaps.
This feature is part of a paid plan.
Every stock page carries a How it trades card, headed with the ticker (on NVDA's page it reads *How NVDA trades*). It holds two reads side by side.
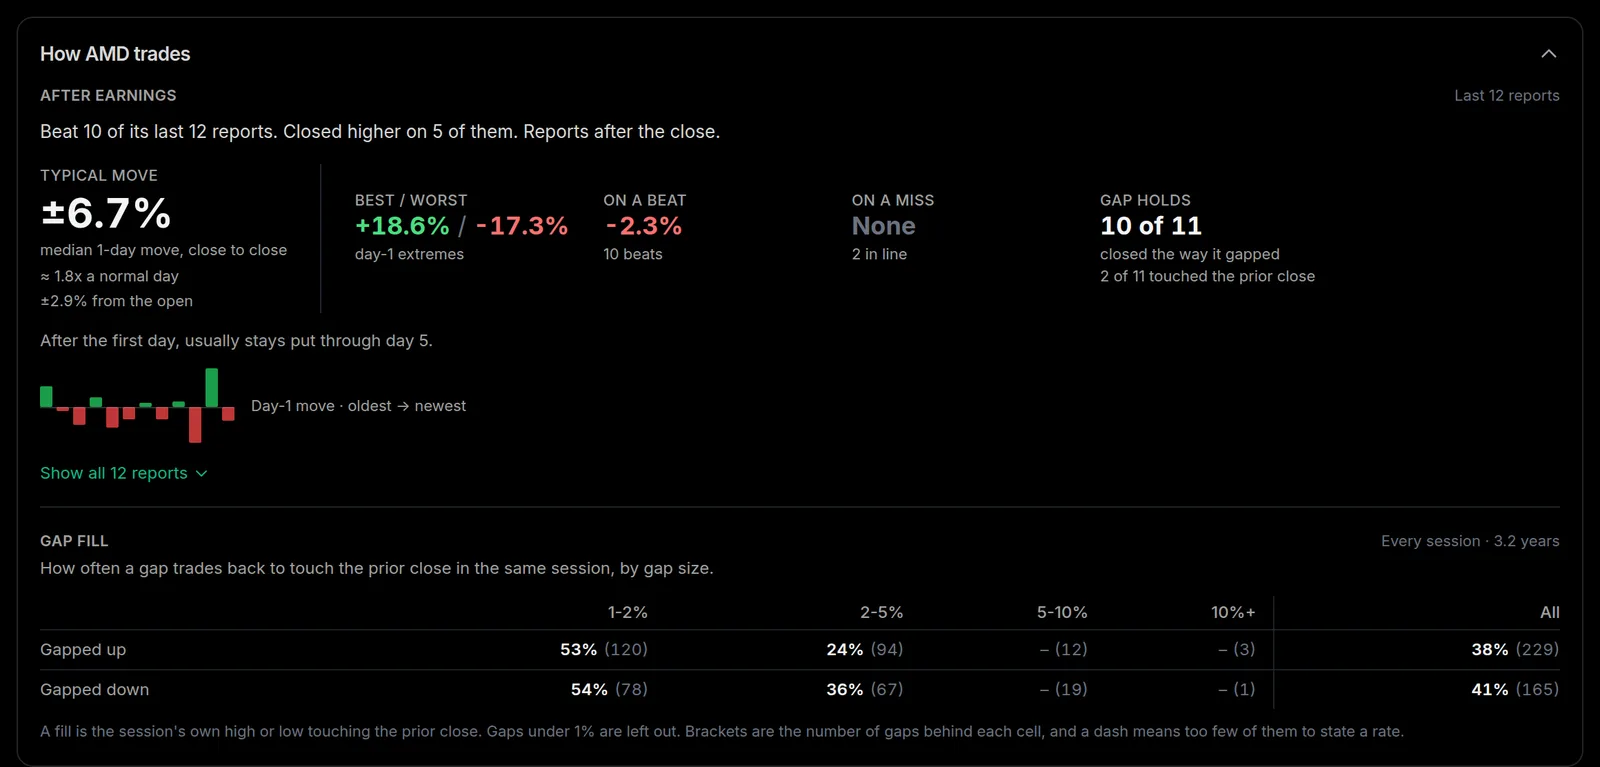
After earnings
Shows how a stock has historically traded around its earnings, using its last few years of reports (up to 12 quarters).
- A one-line read at the top: its beat record, how often it closed higher, and whether it reports before the open or after the close
- Typical move - the median one-day move after a report, also shown as a multiple of a normal day
- On a beat and On a miss - the typical one-day move split by whether the company beat or missed
- Best / worst - the biggest day-1 move in each direction over the same reports
- Gap holds - how often the stock closed the day in the direction it gapped, versus fading, and how many of those gaps traded back to touch the prior close
- A drift read on whether the move tends to keep going or give some back through day 5
- A per-report table with the gap, day 1, day 3, day 5, and reaction-day volume for each quarter
It appears once a stock has at least four reports to learn from.
Gap fill
Shows how often the stock trades back to touch the prior close in the same session after gapping, split by whether it gapped up or down and by how big the gap was. A fill means the session's own high or low touched the prior close.
The rate covers every session we hold daily bars for, including all the days nowhere near an earnings date, and the heading beside it states how many years that is. Where a cell has gaps behind it, the count is in brackets, and a dash means too few of them to state a rate. A bare dash with no count means the stock has never gapped that far in that direction. The rate falls sharply as gaps get bigger, which is why the sizes are broken out.
The per-report table under After earnings also marks whether each individual earnings gap filled. A dash there means we could not check that session, usually because it is older than our price history or has not finished trading yet.
The card is a Pro feature; everyone can see the headline reaction stat.