What every column means: EPS, revenue, year-over-year change, beats and misses, and estimate rows.
Where: Any stock page
The earnings table is the heart of a stock page. Here is what each column means.
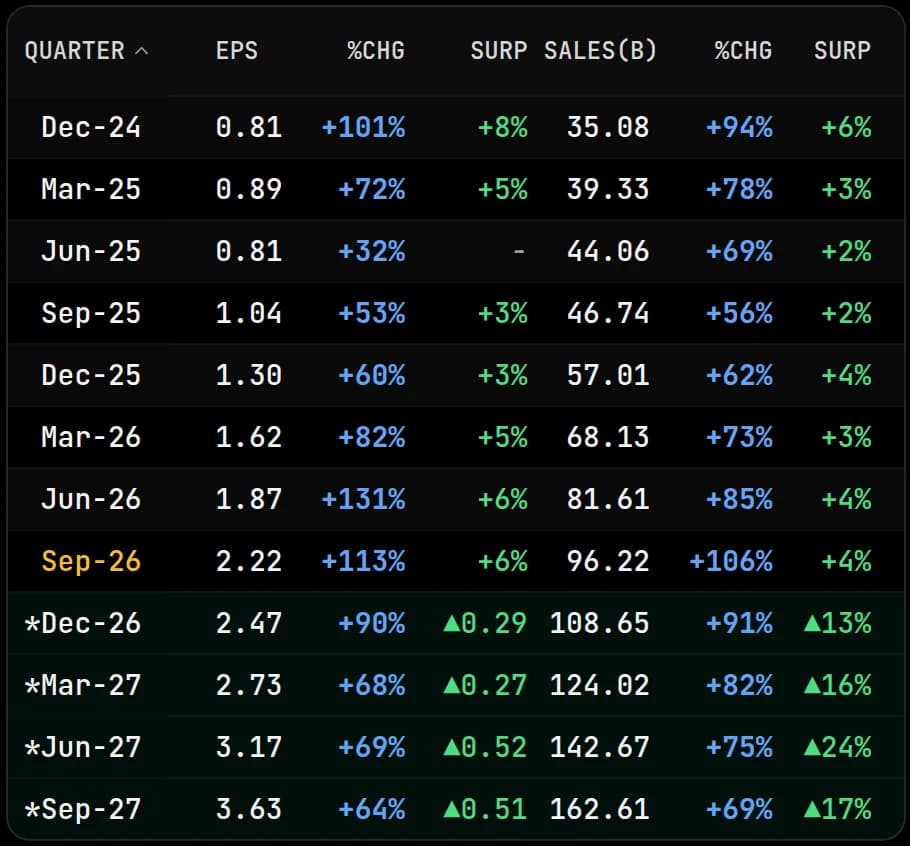
The quarterly table on NVDA. The last reported quarter is highlighted and rows marked * are estimates.
Quarterly columns
Quarter - the fiscal quarter. Click the header to flip newest-first or oldest-first. Rows marked with a \* are analyst estimates, not reported yet.
EPS - earnings per share for the quarter
%Chg (next to EPS) - EPS growth versus the same quarter a year ago
Surp (next to EPS) - on reported rows, how much EPS beat or missed the estimate, as a percentage. On estimate rows, how far analysts have moved the estimate since the earliest reading, in dollars per share (an arrow shows the direction).
Sales - total revenue for the period
%Chg (next to Sales) - revenue growth versus the same quarter a year ago
Surp (next to Sales) - the same beat, miss, or revision for revenue. Revenue stays in percent on both kinds of row.
Green means a beat or an increase; red means a miss or a decline.
Expand a row
Click any quarter to open the report date, GAAP EPS, whether it reported before or after the bell, and, for estimates, how many analysts are behind the number and how it has been revised.
Annual table
Turn on the Annual Table in Settings to get the same EPS, revenue, and year-over-year growth by fiscal year.
Turnaround highlight
When a company swings from losses back to profit, that quarter is highlighted so the turn is easy to spot.