Turn stock-page sections on or off so your layout shows exactly what you care about, nothing more.
Where: Settings -> Stock page
The stock page packs a lot in. In Settings -> Stock page you decide which panels appear, so your layout shows only what you actually use.
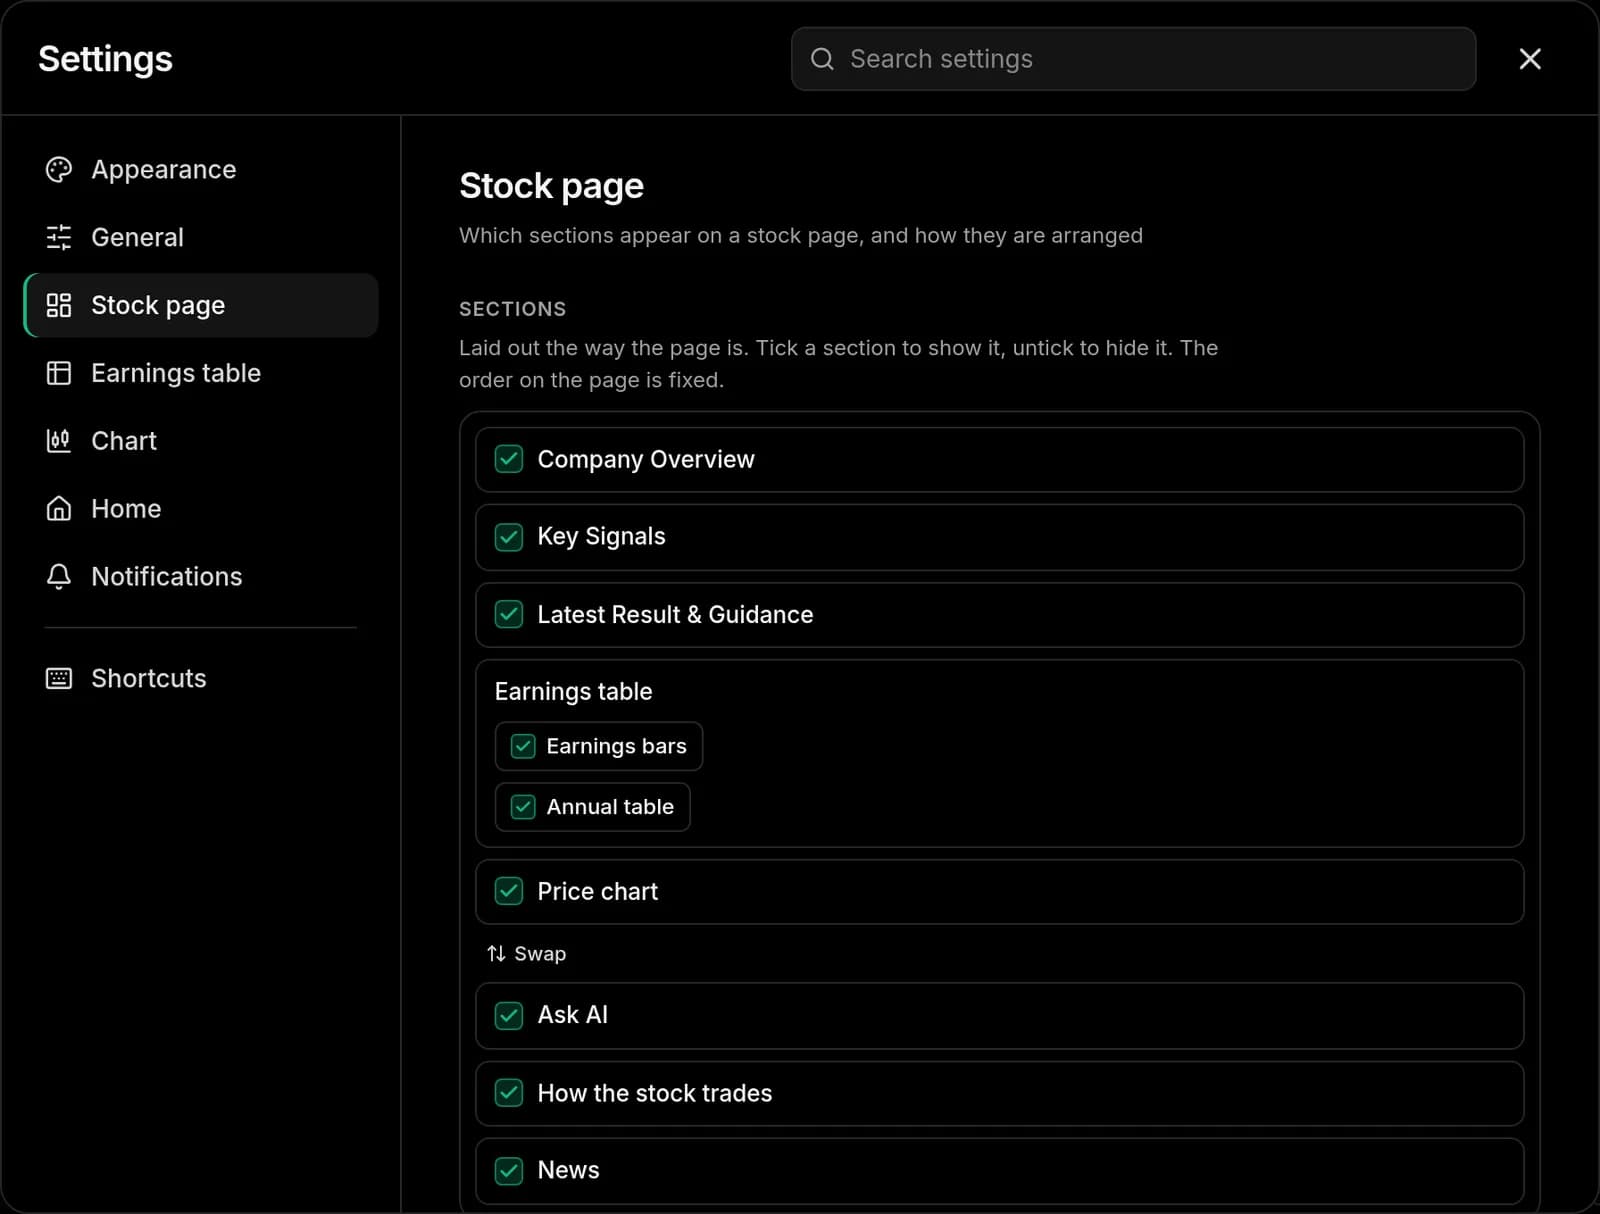
Settings, Stock page: tick a section to show it, untick to hide it
Panels you can show or hide
The list is laid out the way the page is. Tick a section to show it, untick it to hide it.
Company Overview - profile, institutions, insiders, analysts
Key Signals - the strongest highlights across every tab
Latest Result & Guidance - the last report and the company's own outlook
Earnings table, with Earnings bars (EPS and sales bar charts) and the Annual table (yearly data alongside the quarterly table)
Price chart - the interactive candle chart. Swap moves it to the other side of the table.
Ask AI - ask questions about the stock
How the stock trades - how the stock moves after it reports, and how often it closes its gaps
News - recent articles
Under Arrangement you can pick a compact or classic layout for the profile stats, and put the annual table below the quarterly one. Reset puts everything back.
Extra columns
Optional earnings table columns live in Settings -> Earnings table, under Columns:
Report date - the day each quarter was reported
Estimates - what analysts expected, next to what was reported
Net margin - per-quarter net profit margin
ROE - per-quarter return on equity
Post-earnings move - how the stock moved after each report
Report date is free. The other four are part of a paid plan.