Find your way around a stock page
What each part of a stock page shows, from the stats at the top to the news at the bottom, and where to read more.
Every stock page has the same layout, top to bottom. This guide walks through it on AMD.
The header
The company name, its themes, and the price, with the pre-market or after-hours change under it when there is one. Track adds the stock to Watching or to one of your lists.
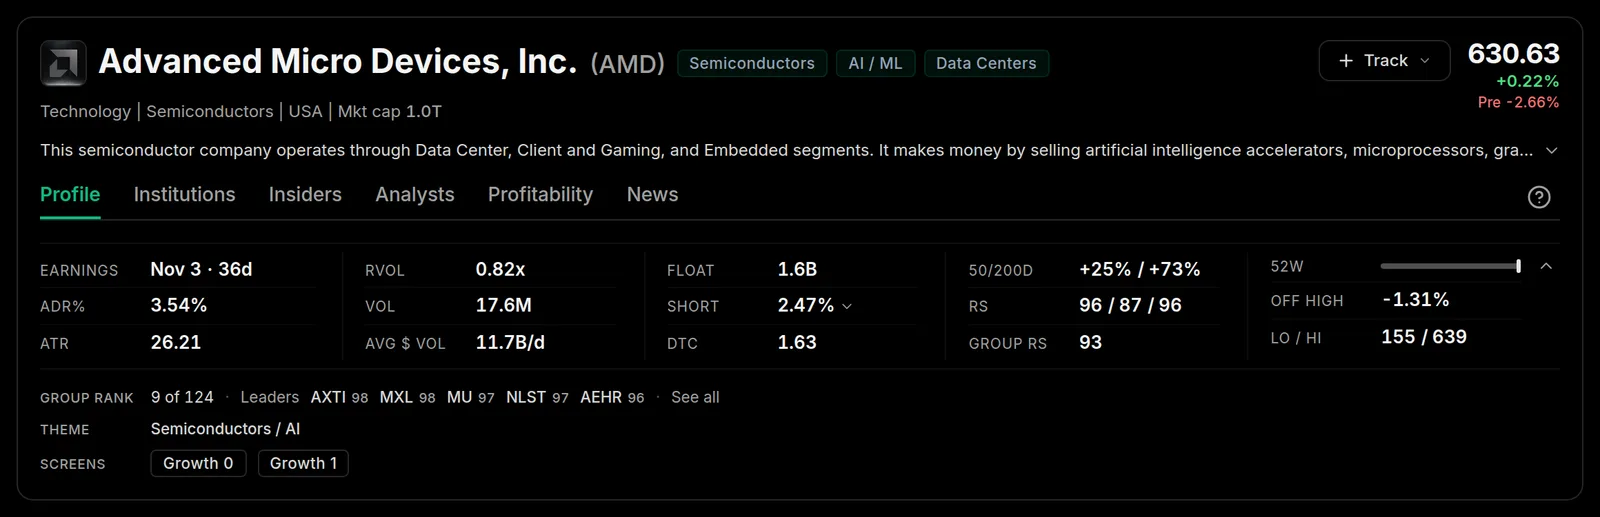
The stats under the tabs:
- Earnings - the next report date and how many days away it is
- ADR% - the average daily range over 20 sessions, as a percent of the close
- ATR - the average true range over 14 sessions, in dollars
- RVOL - today's volume against the 20-day average
- Vol and Avg $ Vol - shares traded today, and the average dollar volume per day
- Float, Short and DTC - shares free to trade, the percent of float sold short, and days to cover
- 50/200D - how far the price sits from its 50-day and 200-day moving averages
- RS - the RS Rating over 12 months, 3 months and 1 month, where 99 is the strongest stock in the market
- Group RS - the same rating for its industry group
- 52W, Off high and Lo / Hi - where the price sits in its 52-week range
Under them, Group rank shows where the industry group ranks and its strongest names, then the stock's theme and any growth screens it passes. Hover any label for the exact definition.
The tabs
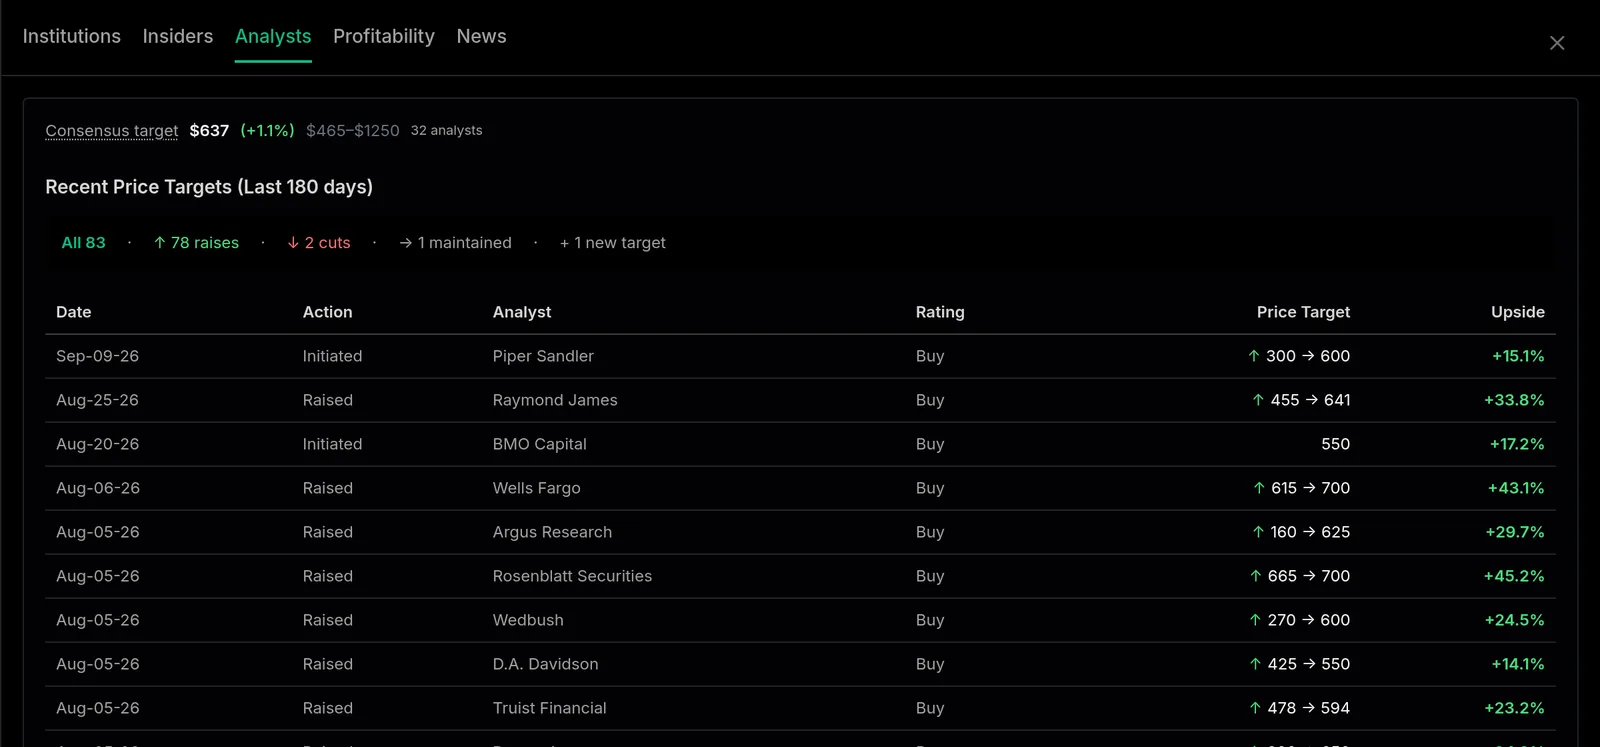
Profile is the view above. Institutions, Insiders, Analysts, Profitability and News open the data drawer over the page, so you can check who owns the stock or what analysts did without losing your place. Press \ to open or close it. More in The data drawer on a stock page.
Key Signals
A row of tiles for whatever stands out right now: a news catalyst, a big volume day, a new high, insiders or institutions buying or selling. Click a tile to jump to the details. The row only appears when something qualifies. More in Key Signals.

Latest result and guidance
The bottom line is the last reported quarter: EPS and sales with their year-over-year growth, and how the stock moved on the first day after (1D). The line above it is the company's own guidance for the coming period, next to what analysts expect.
Rundown opens a written summary of that report, and Call analysis a read of the earnings call. Both are part of a paid plan.

Earnings and the chart
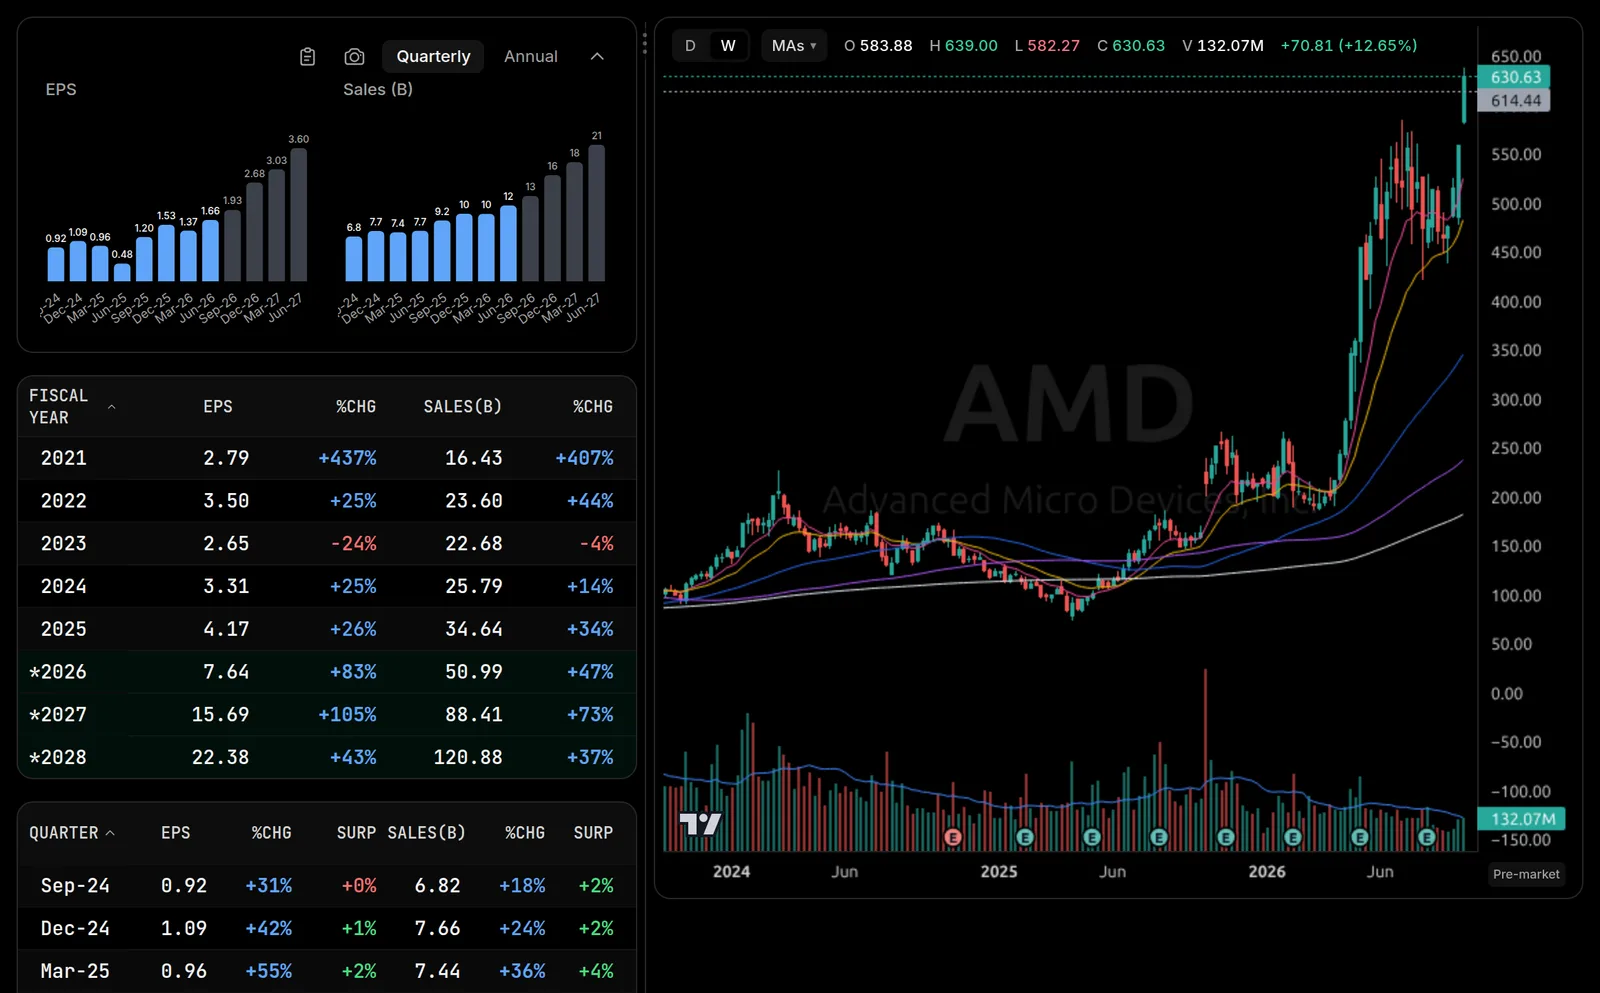
EPS and sales bars, the annual table and the quarterly table, beside the price chart. The E markers along the bottom of the chart are report dates. More in How to read the earnings table and Make the price chart yours.
Ask AI
Ask anything about the stock in plain English, or start from one of the suggested questions. Follow-ups remember the whole conversation. Ask AI is part of Pro, with a monthly allowance of conversations.

How it trades
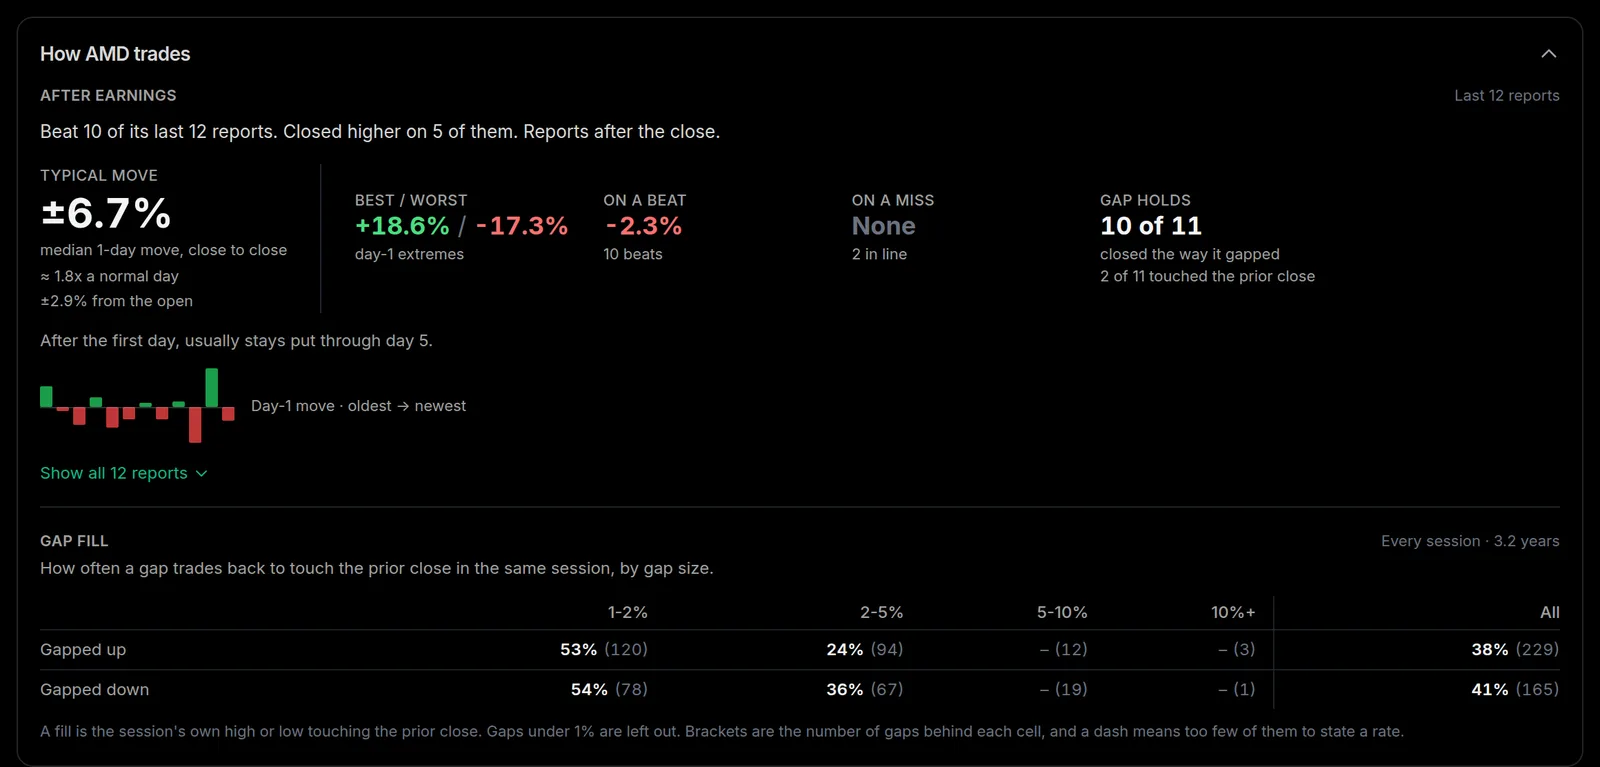
How the stock has moved after its recent reports: the typical move, the best and worst days, and how often the gap held. Under it, Gap fill shows how often any gap trades back to the prior close. Click the header to open it. More in After earnings, and gap fill.
News
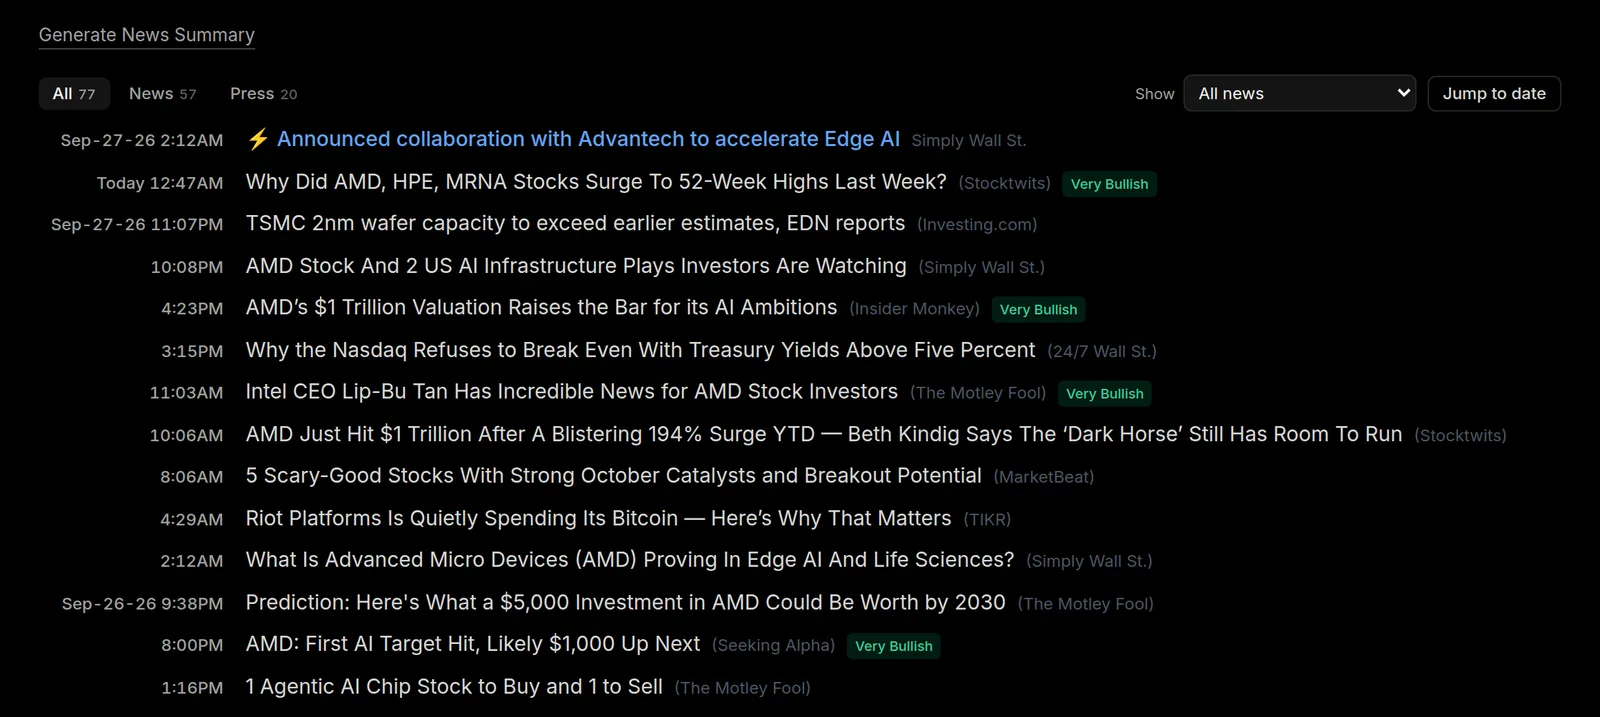
Recent headlines, split into All, News and Press, with a sentiment tag on the ones that count. Generate News Summary writes a short summary of the recent coverage. More in News, sentiment, and the News Summary.
Hide what you don't use
Every section above can be turned off in Settings -> Stock page.